TM 11-6625-444-14-2
h. Observe the display. It will indicate the
g. Push the POWER switch to the ON posi-
measured true rms ac voltage.
tion.
NOTE
b. Connect the test leads to the HI and LO lN-
PUT terminals, the red test lead to the HI termin-
al and the black test lead to the LO terminal.
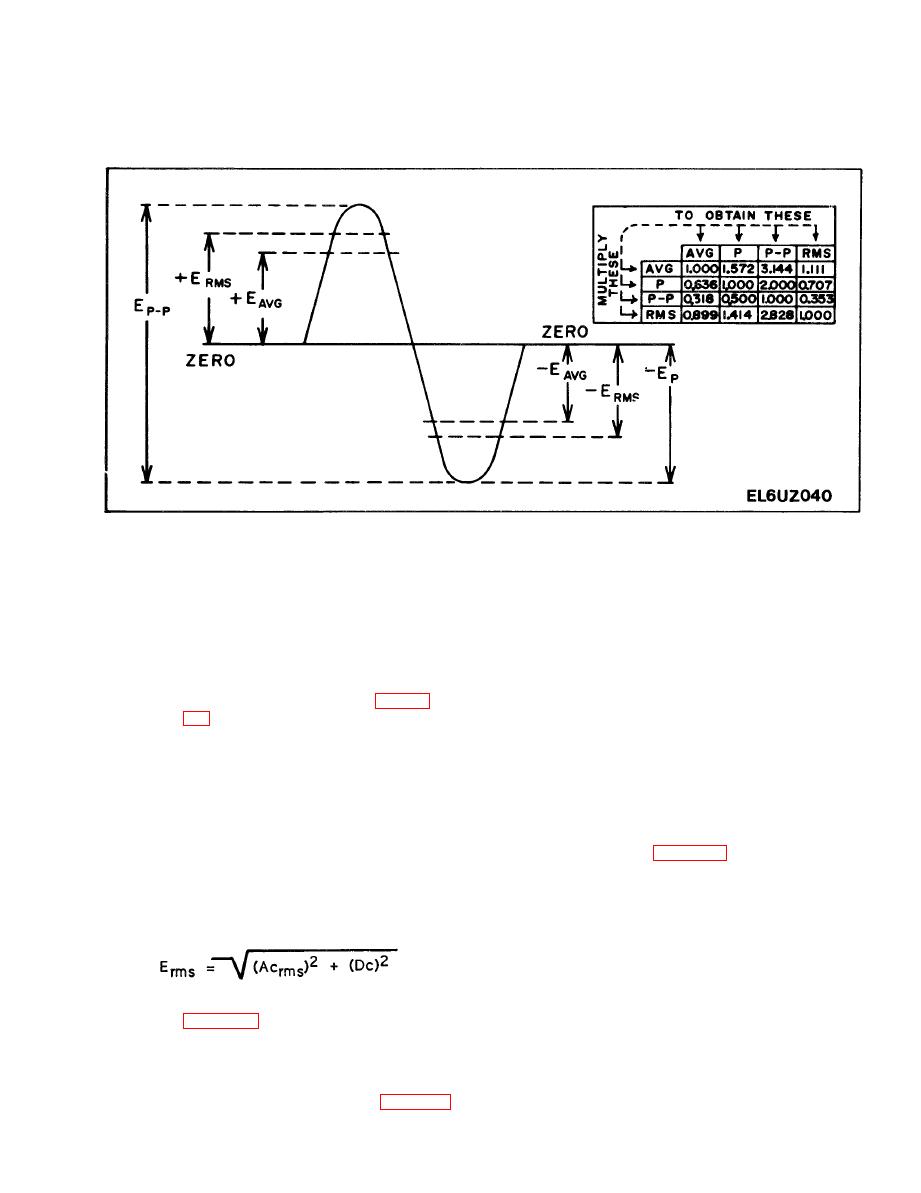
The voltmeter will measure the rms
value of a sine wave including the
harmonics. It will respond to the
c. Push the AC+DC VOLTS switch to the in
rms value regardless of the phase
position.
of the input signal components. Fig-
ure 3-5 shows the sine wave rela-
tionship of average, rms and peak
NOTE
value.
If a guarded measurement is not nec-
essary, leave the GUARD switch in the
NORM position. For guarded measure-
ments push the switch in to the EXT
The voltmeter is capable of making measure-
position. See para 3-3.
ments of an ac rms voltage superimposed on a
dc level. Being a true rms voltmeter, it responds
d. Push the FILTER switch in to the LP/10 kHz
as given by:
position if the frequency of signals to be mea-
sured is known to be lower than 10 kHz. For
f r e q u e n c i e s higher than 10 kHz, leave the
FILTER switch in the out position.
Refer to figure 3-6 for illustrations of the ef-
e. For frequencies lower than 40 Hz, push the
feet of a dc offset voltage on the rms value of a
SLOW RESPONSE switch to the in position to a-
10 V peak-to-peak square wave.
For frequencies
chieve specified accuracies.
higher than 40 Hz, leave the switch in the out
position to obtain fastest readings.


