TM 11-6625-2629-14&P
the vertical input terminals of the oscilloscope.
Connect the other end of the cable to pin 6 of V7
and to ground.
presentation of the response curve.
g. Loosely couple a marker of 12 MHz into pin
7 of V2. "Use the low frequency generator to
generate the 12-MHz marker. This marker should
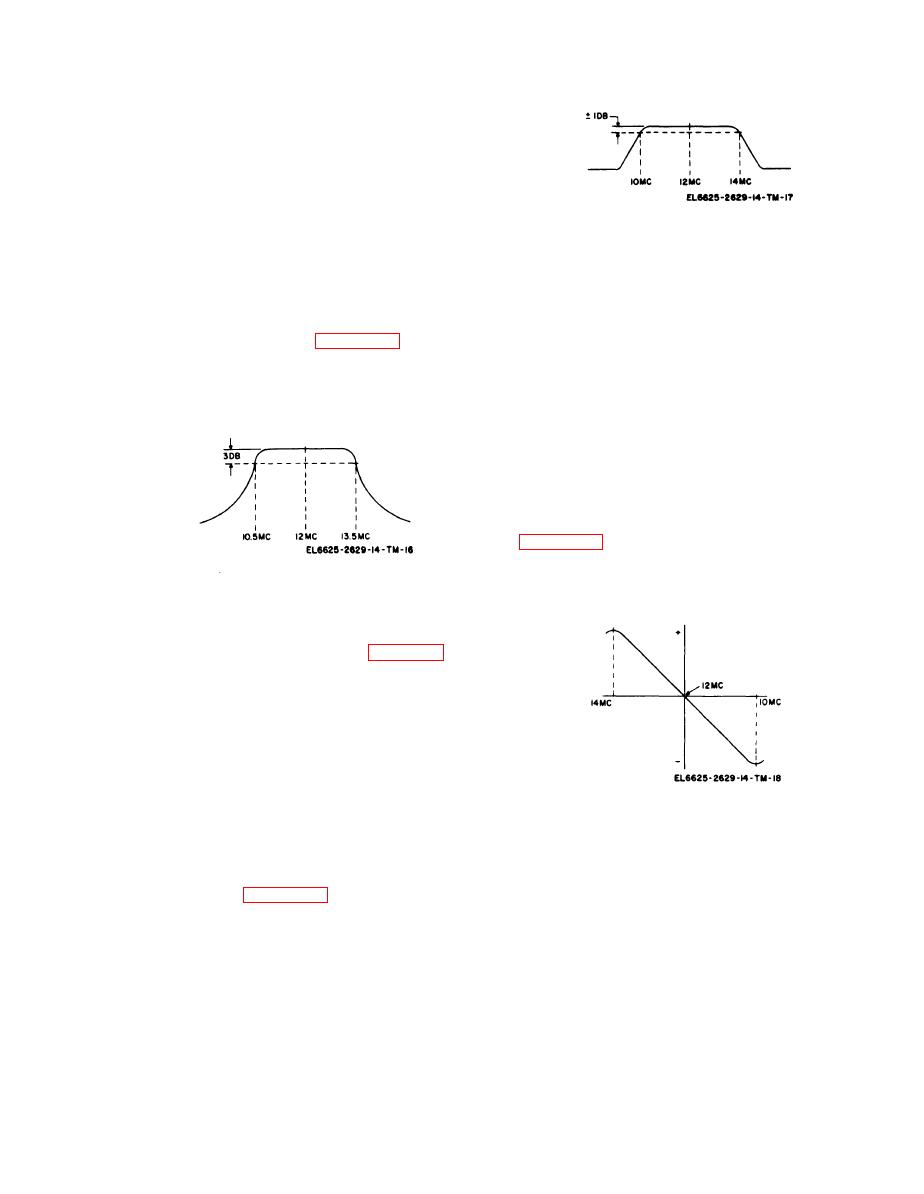
Figure 7-10. Limiter response curve.
a p p e a r approximately at the center of the
7-25. Discriminator Alignment
response curve.
a. Repeat the procedures given in paragraph 7-
h. Adjust the markers to the 3-decibel (dB)
23 a through d.
points on the response curve. These points should
b. Connect a shielded cable from the junction
be at approximately 10.5 and 13.5 MHz.
of R73 and R74 to the vertical input terminals of
i. If the response curve does not resemble
the oscilloscope. Use a 10,000-ohm resistor in
closely that shown in figure 7-9, adjust the
series; NO NOT use the bypass capacitor to
trimmers of T6, C109, and T1 in that order.
ground.
Repeat as required.
c. Adjust the signal level until limiting occurs
j. Disconnect the test equipment.
as indicated by a. rapid decrease of noise level on
k. Reconnect the if cable to the mixer housing.
the oscilloscope.
response curve that covers about two-thirds of
the screen.
e. Loosely couple a marker to the probe and
check the location of the 10-, 12-, and 14-MHz
markers. These points should be as shown in
f. If the discriminator is out of alignment,
adjust C73 for proper center frequency. Adjust
Figure 7-9. If amplifier response curve.
C77 for proper peak separation.
7-24. Limiter Alignment
U. Repeat the procedure given in paragraph 7-
23 a through d.
6. Connect the shielded cable (para 7-23) from
pin 5 of V9 to the vertical input of the
oscilloscope.
c. Adjust the oscilloscope controls to obtain a
response curve presentation. Increase the output
level of the sweep generator until limiting occurs
as indicated by a sudden widening of the response
curve.
d. Loosely couple a marker of 12 MHz into V9.
Figure 7-11. Discriminator response curve.
It should appear approximately at the center of
the response curve. Check the location of the
7-26. Deviation Meter Calibration
markers at 10, 12, and 14 MHz. The response
To determine the accuracy of the DEVIATION
curve should be flat within 1 dB over this band.
meter calibration, calibrate the output of the fm
e. If the response does not resemble closely
signal generator by using the panoramic in-
that shown in figure 7-10, adjust trimmers of T7
dicator.
first, and work toward the integrated circuit, U1.
a. Connect the equipment as shown in figure 7-
f. Disconnect the test equipment.
13.
g. Reconnect the if cable to the mixer housing.
7-17


